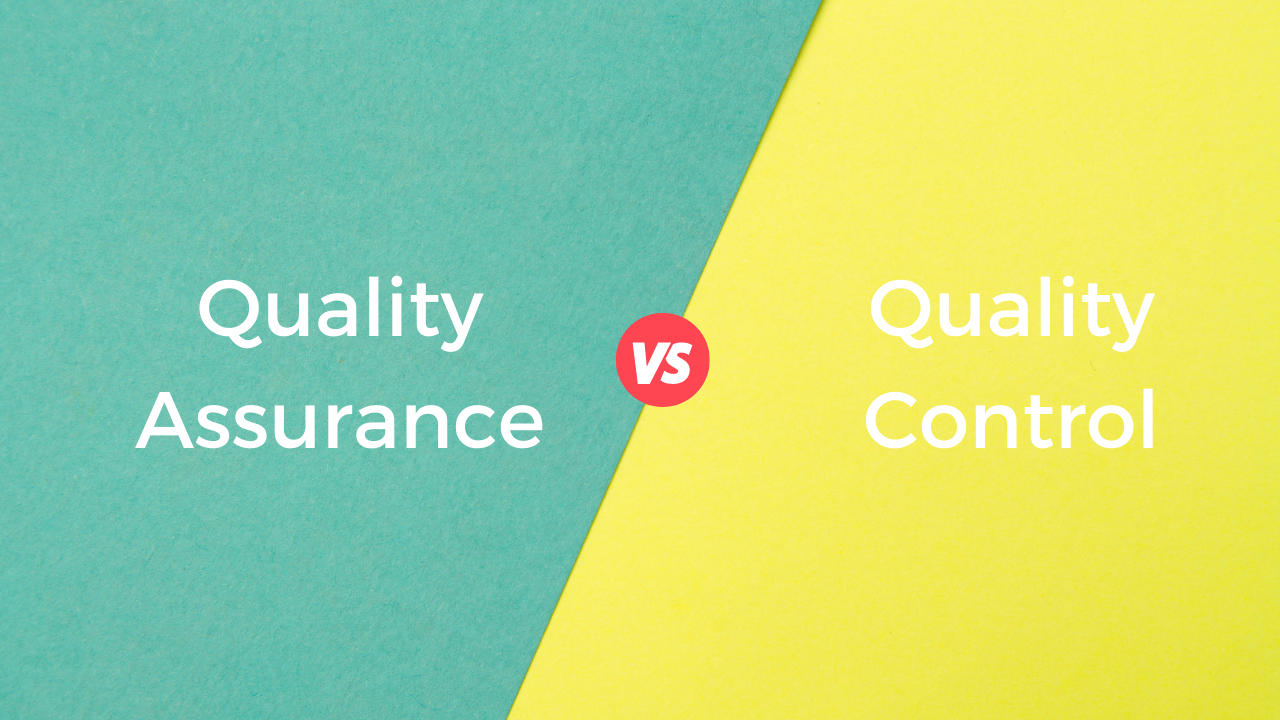
The difference between Quality Assurance vs Quality Control has many organizations wondering what makes them different (and similar).
Quality Assurance vs Quality Control
What’s the difference?
Well, that’s the question puzzling plenty of small to medium-sized organizations who don’t have the budget to hire both a QA specialist and a QC specialist.
It’s common for a business to hire a quality assurance engineer and give them quality control duties and vice versa.
That’s because while the jobs may seem similar, they’re different in a few key ways. Which happens with a lot of methodologies. It’s similar to agile methodology vs lean. They’re similar but still different.
We’ll show you the difference between quality assurance and quality control so you can make sure you hire the right person for the jobs you need done. But we’ll also show you the 7 tools used by both QA and QC specialists that make them seem so similar.
But first, let’s define quality assurance and quality control.
What is Quality Assurance?
To answer this question we have to first find the answers to these:
- What is quality?
- What is assurance?
What is Quality?
According to the International Organization for Standardization (ISO) 8402, “quality” is defined as:
“The totality of features and characteristics of a product or service that bears on its ability to satisfy stated or implied needs.”
And in ISO 9000, quality is defined as:
“The degree to which a set of inherent (existing) characteristics fulfills requirements.”
Both of these definitions can be summarized as follows:
Quality is meeting or exceeding customers’ needs and desires.
Because if the customer doesn’t like it, it’s not high-quality.
What is Assurance?
Assurance is about trust. The purpose of assurance is to provide stakeholders with the confidence that their product is free of defects and glitches, meets the standards outlined, and will satisfy customers.
So, what is quality assurance?
The ISO 9000 describes quality assurance as a “part of quality management focused on providing confidence that quality requirements will be fulfilled.”
Quality assurance professionals undergo a process of planning, documenting, and finalizing the directions and strategy for creating a high-quality product. QA specialists define the requirements and expectations for the end product.
Here’s what a quality assurance engineer needs to know to do their job:
- What information will be supplied.
- How the product will be supplied.
- Whether or not the outlined requirements for the product will actually meet customer demands.
- Whether or not the requirements are being followed.
- And whether or not the product meets the outlined requirements.
QA specialists have to do their jobs before QC specialists can do their jobs.
QA specialists will create deliverables in the form of checklists, audits, standards, methods, and processes that should ensure a high-quality end-product.
What is Quality Control?
Quality control is concerned more with detection of defects rather than prevention of them.
Once again, to define quality control we first have to define “control.”
What is Control?
Control is about testing and verifying the results of the final product compared to the established standards.
So, what is quality control?
Quality control is about identification of defects and problems with the product. QC specialists ensure that the standards laid out by QA specialists are followed and that the final product is of high-quality.
Quality control detects and reacts to problems within the confines of stated outcomes for the product, its stated functionality, design, etc.
Quality control activities include:
- Inspection
- Peer reviews
- And testing
Quality Assurance vs Quality Control
QA and QC specialists are intimately linked but very different, nonetheless. They both fall under the heading of Quality Management but where quality assurance sets standards, quality control verifies the product meets them.
Quality assurance is the guiding hand for product development and quality control is the scrutinizing inspector that verifies a job well done.
Essentially, QA is about processes and QC is about end products.
Let’s walk through the rest of their differences one by one:
The Goals of Quality Assurance vs Quality Control
The goal of QA is to ensure a smoother, smarter, better development process to limit the possibility of defects.
The goal of QC is to identify any and all defects present in the product (that occur as a result of poor QA policies or other reasons). These defects are detected after the product is developed but before it’s released onto the market.
How Quality Assurance Works vs How Quality Control Works
Quality assurance sets quality standards and product management standards for proper operations.
Quality control uses a variety of tools and equipment to search for, find, and eliminate any sources of issues that did arise or could arise within the product.
Responsibilities for QA Specialists vs QC Specialists
Almost every single person on the team developing a product is somewhat responsible for quality assurance. Quality assurance can be undertaken by the product development team or by an outside third-party.
Quality control is almost always outsourced to a third-party who is responsible for testing the product.
What are the 7 Tools of Quality Used for Both QA and QC?
Despite the many differences between QA and QC, they have many similarities. In particular, the tools used in both processes.
As with the many types of software testing, QA and QC engineers have many tools at their disposal and the following are the most essential ones.
Cause-and-Effect Diagram (Fishbone or Ishikawa Diagram)
The cause-and-effect diagram was originally known as Ishikawa or Fishbone chart. It was developed by the Japanese organizational theorist named Kaoru Ishikawa.
The purpose of the fishbone diagram is to identify numerous possible causes both effects and problems. It’s extremely helpful when planning brainstorming sessions because it helps teams get out of a rut in their thinking and it helps you sort ideas into useful categories.
Here’s how to draw a fishbone diagram:
- Draw the head of the fish so it’s pointing right to represent the problem or cause. Write your problem (the effect) inside the head.
- The spine extends from right to left, from the head to the opposite end of the page.
- The bones branch off from the spine and angle backwards to the left.
- Each bone is a representation of a single cause or event.
- Each major bone can incorporate smaller bones branching off from them, representing sub-causes.
When brainstorming the causes of the effect, try to be as specific as possible. Keep asking the question, “why does this happen?” If you can’t think of any specifics right away, then try these generic statements:
- Methods
- Machines
- People
- Materials
- Measurement
- Environment
Check Sheet
A check sheet is a basic data collection and analysis tool used for collecting and analyzing data. There are numerous reasons to use a check sheet such as:
- Observing and collecting data by the same person at the same location.
- Collecting data regarding the frequency of defects, their locations, problems, etc.
- Collecting data from production processes.
Here are the basic procedures for check sheets:
- Determine the event or problem to be analyzed.
- Choose when the data will be collected.
- Lay out the form in a way that allows you to record data and make marks (like X’s) so data doesn’t have to be recopied.
- Label every space on the form.
- Test your check sheet to ensure it’s collecting the right data and that it’s easy to use.
- Every time a problem occurs, record the data on the check sheet.
The common layout for a check sheet will have:
- Who recorded the data.
- Where and when it was collected.
- What every mark on the check sheet means.
- And why the data was collected.
The purpose of the check sheet is to ensure workers are following proper procedures so they won’t make a mistake.
Control Charts
Control charts help you understand how processes change over time (variations). It compares current data to historical control limits to discover whether the variations are “in control” (consistent) or “out of control” (unpredictable).
Data on the control chart is plotted and ordered according to time. It has a central line running through it to represent the average, a line on the upper part of the graph for the upper control limit and a line on the bottom of the graph for the lower control limit.
Here’s when QA and QC specialists use control charts:
- To correct problems as they occur when controlling ongoing processes.
- To forecast a range of outcomes from a process.
- To determine whether or not a process is stable.
- To find and analyze patterns of process variation from non-routine events along with common causes.
- To determine whether you should attempt to prevent certain problems or make major changes to the process.
Histogram
A histogram shows frequency distributions in a set of data.
QA and QC engineers rely on histograms to:
- To show data that’s numerical.
- To see the shape of distribution for a set of data.
- To analyze whether or not a process meets customer requirements.
- To analyze the output from a suppliers process.
- To see if a process change has occurred within a time period.
- To figure out if outputs of two or more processes are the same or not.
Pareto Chart
The Pareto chart, also called the Pareto diagram or Pareto analysis shows which situations are most significant.
Each bar length represents frequency or cost and they’re arranged alongside the longest bars on the left while the shortest bars are on the right.
Reasons for using the Pareto chart:
- To see the frequency of problems in a process.
- To be able to focus on the most significant problems.
- To communicate the data with others.
The Pareto chart is based on the Pareto principle which states that “roughly 80% of the effects come from 20% of the causes.”
Scatter Diagram
A scatter diagram, or scatter plot displays pairs of numerical data on a graph with one variable on each axis.
When the variables are correlated they come together along a line or curve. When the points are tight on the graph that means the correlation is very high.
QA and QC specialists use scatter diagrams when dependent variables have multiple values for every independent value or when determining whether or not two variables are related.
Stratification
Stratification is when you separate data from a variety of sources so patterns can be recognized.
Basically, you’re sorting data, people, and objects into groups. Stratification is commonly used in conjunction with other data analysis tools.
Here are different types of data to be stratified:
- Suppliers
- Departments
- Equipment
- Products
- Time of day
- Day of week
Need Quality Assurance for Your Next Project?
“Good enough” doesn’t cut it for consumers today. Your products need to be exceptional.
But developing new products at breakneck speed (while maintaining quality) is next to impossible without incurring costly post-release bugs and updates.
What you need is a mix of full-cycle testing tools, process improvement strategies, and ongoing quality governance.
We can provide that and more to you.
ATC specializes in quality assurance. We can help you:
- Reduce development costs, optimize software quality, and enhance business value through fully managed testing services.
- Develop detailed, exhaustive, realistic plans to help you manage change and establish new processes and policies that maintain quality across your organization and projects.
- Build and manage a center for quality assurance and implement the tools, frameworks, and methodologies needed to seamlessly blend QA into your development lifecycle.
Reach out today to optimize quality assurance in your organization.
Subscribe to the blog